Heritage Web GIS: an interactive map with Leaflet and GeoJSON
A geomatics database only earns its keep once it leaves the back office to become a tool for decision-making or discovery. For an elected official, a citizen or a visitor to take ownership of a territory, the data has to be legible and interactive. That is the whole point of a Web GIS. Through this platform, which now covers ten Local Action Group (LAG) territories in Moldova — starting with my home village of Onișcani, in the heart of the Codrii — I show how I turn raw geospatial data into a smooth, multilingual map that works anywhere. The map is live in my portfolio.
I run CODRUM, a geomatics and web development studio. I build these tools so they serve as visual arguments: backing a grant application, mapping a tourist route or managing municipal infrastructure.
Why a Web GIS rather than a static map?
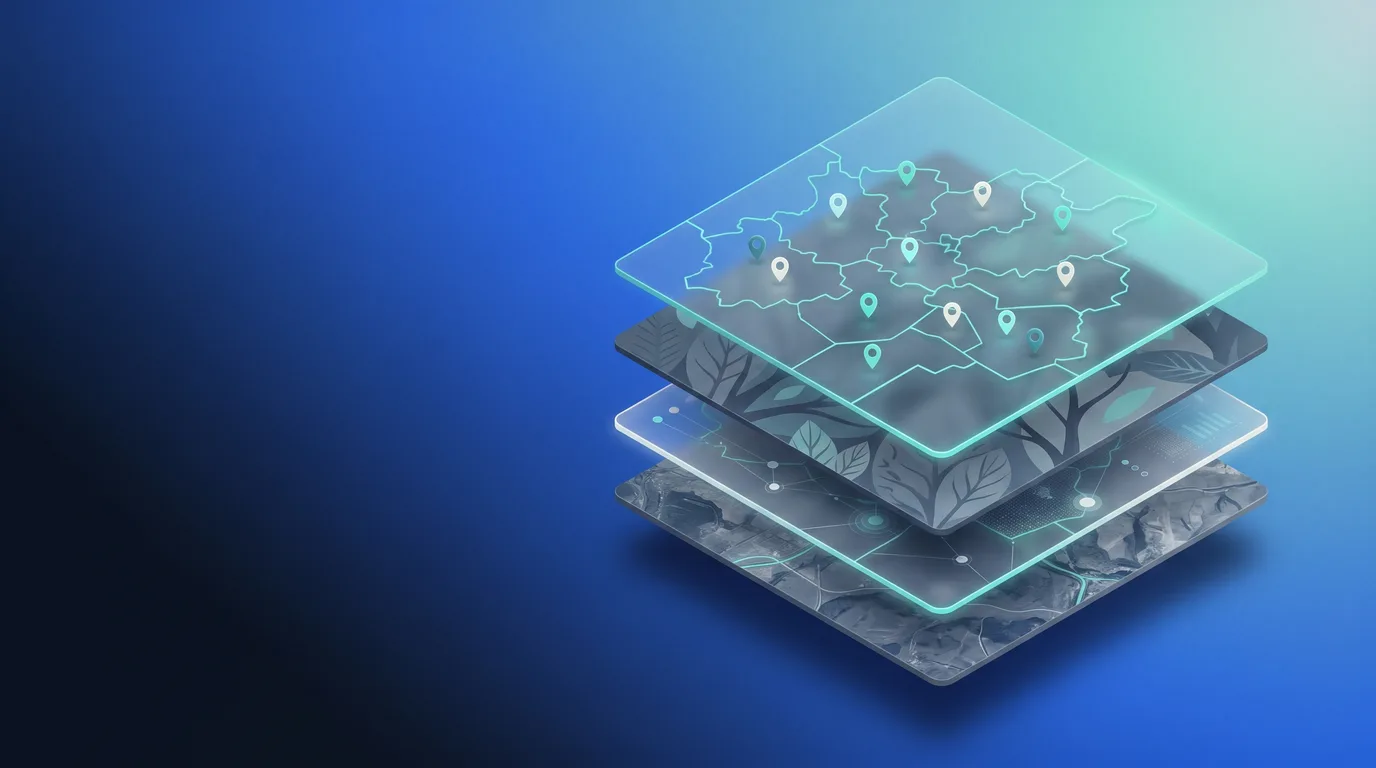
A PDF or a paper map imposes a single, predetermined reading. A Web GIS hands control back to the user: show heritage alone, add administrative boundaries to grasp land-use stakes, overlay the forest cover, search for a specific site. Each layer tells one facet of the territory, and the user composes their own narrative. My design rests on three requirements: minimal load time (essentials first, detail on demand), an interface built mobile-first — the real screen of decision-makers and residents alike — and native multilingual support (Romanian, Russian, English, French) to reach every audience.
The data: official orthophoto, ground, remote sensing
A map is only as good as its sources. Here the basemap is not a generic satellite image but the official orthophoto of the Agency for Land Relations and Cadastre (AGCC), served as a WMS stream from geodata.gov.md — the reference data, the one behind cadastral deeds. On top, I assemble the road network, hydrography and the Codri forest cover, cross-referencing OpenStreetMap data with my remote-sensing study. The heritage inventory is the core of the app: 30 geolocated sites — from Hârbovăț Monastery, the one featured on the 50-lei Moldovan banknote, to listed wooden churches and Geto-Dacian archaeological sites — for the Codrii Călărașului territory alone. Every vector layer is cleaned, reprojected and trimmed (reduced precision, simplified geometries) to stay fluid even on a phone over 4G.
The architecture: Leaflet and GeoJSON, light and durable
No need for a heavyweight stack. The map runs on Leaflet — the reference open-source mapping library — and on optimised GeoJSON files. Layers are organised into toggleable groups, the orthophoto and relief basemaps arrive over WMS, and the interface uses a sliding bottom-sheet on mobile. No heavy dependency, no proprietary account, no licence fee: it all fits in a self-contained page, published under the MIT licence. That sobriety is a durability choice — a local authority must be able to host and maintain its tool without depending on a vendor.
From static to dynamic: PostGIS behind the showcase
This demo is static, but it rests on a full production logic. In parallel I build Web GIS architectures where data lives in a PostgreSQL/PostGIS database and is served dynamically as GeoJSON through PHP endpoints. A local authority can therefore start with a presentation map, then move to a tool where its staff add, edit and export their own data — in real time, without touching the code. It is the logical sequel to the work on my geospatial database on Jakarta's urbanisation.
Transferring the method: heritage, tourism, planning
The approach is universal. The structure used for the heritage of these territories adapts to tracking a sewer network, a zoning plan, waste-collection points or a hiking trail. A Web GIS pays off the moment a territory wants to show, share or decide on a spatial basis. It closes an engineering cycle: after multi-criteria analysis in QGIS (choosing where to build) and spatial analysis for local authorities (understanding a territory), it makes the results public and defensible.
On pricing I stay transparent: an online Web GIS map (your data integrated, official basemap, multilingual, mobile) starts at €1,500; a dynamic Web GIS app backed by an editable PostGIS database at €2,500. Based in Morsang-sur-Orge, I work across Essonne, Île-de-France and remotely — including internationally, as this Moldovan project shows. Let's talk about your territory: free scoping, quote within 48 h.
For a full breakdown of services and price ranges, see the Services & Pricing page.
Articles liés
Développeur web freelance à Morsang-sur-Orge et en Essonne (91)
Pourquoi choisir un freelance local plutôt qu'une agence parisienne, mes services pour les PME de l'Essonne, communes couvertes, projets 2026 et tarifs transparents.
Création de site vitrine PME avec React + Vite : standards 2026
Pourquoi React + Vite + SSG bat WordPress sur la performance, la sécurité et le coût d'hébergement, avec deux études de cas Clad-Primeco et Milena Glow Up.